It had been an exceptionally windy few days, so there was only one subject for a discussion group that week. “What is wind; what causes it?” in the words of the ever curious Wendy.
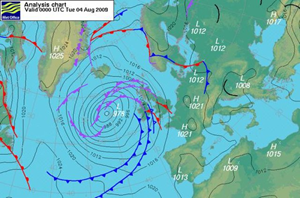
Figure 1 Weather map showing fronts
Sharing the notions they’d picked up from weather reports, the group soon appreciated that it had to do with pressure. As so often happens with scientific explanations, this merely served to put back the question one step: what is pressure? Jean commented that: “you feel it but you can’t see it. I can understood pressure in relation to water; you know that it increases as you go deeper”. Helen picked up on a previous discussions about air: “it’s something; you can’t see it, but the molecules come closer when you compress it”; adding on further reflection: “it’s lighter up in space – the air gets less dense doesn’t it.
By pulling together these recollections, the group had nailed the main points about pressure. The atmosphere is a mixture of molecules of various gases – mainly nitrogen (78%) and oxygen (21% ) but also with traces of argon, water vapour and, increasingly, carbon dioxide. These molecules are very thinly spread: the distance between them being around ten times the size of each molecule. And, as any one who has walked up a mountain knows, the atmosphere does indeed get less dense as you move upwards from the Earth’s surface: the molecules get even more thinly spread, with altitude.
But molecules, though very, very tiny, still have mass. This means they are attracted by the enormous mass of the Earth towards the centre of the Earth. This force of attraction is what we know as gravity. The effect of this force, pulling downwards on things, is what we experience as their weight. So molecules in the air, despite their minute size, have weight. This weight is not much: just over a kilogram for a cubic meter of air. Above us, however, the atmosphere extends a long way – about 100km, conventionally. So a lot of molecules of air sit above us and together they weigh quite a bit: about 10,000 kilograms (10 tonnes) pressing down on every square metre. It’s this pressure that we measure with our barometers. An explanation of the barometer is given in the Further Reading section at the end.
As an interesting aside, it’s worth considering why we humans aren’t simply crushed by the pressure of the atmosphere around them – equivalent approximately to a tonne weight pressing down on our heads. The fact that we aren’t crushed tells us that our bodies maintain a roughly equivalent pressure internally which balances this. This is not usually noticeable, though a rapid ascent up a mountain or in an aeroplane can cause a kind of pressure sickness and popping of the ears, as the Eustachian tubes open to balance the pressure in the middle ear with that of the surroundings. Space travellers wear protective suits, one purpose of which is to isolate them from absence of pressure in the vacuum around them.
Highs and lows
We become aware that the pressure of the air varies thanks to the daily weather forecasts on radio and TV. Areas of high and low pressure are indicated in weather maps, such as the example in figure 1, above. The labels H and L signify areas in which the local pressure is relatively higher or lower than average.
Conversation in the discussion group moved on at this point, with Helen asking “what’s a depression – what causes it?” Wendy had picked up the idea that it indicates a storm system. Jean had gathered that depressions “seem to start over the ocean, and sometimes develop into hurricanes”. Patrick had looked at several books to understand the causes of our weather but found the explanations baffling. It’s not easy to visualise what is going on in an all-pervasive but invisible gaseous substance – especially as it is happening in three dimensions, not just across the surface of the Earth.
A key idea is that the air in the atmosphere surrounding the Earth can be imagined as a collection of “air masses”. The UK Met Office defines these as “a body or ‘mass’ of air with uniform weather conditions, such as similar temperature and humidity. Air masses may cover several million square kilometres and extend high up into the atmosphere. They are primarily defined by the area in which they originate”. A good example is the air mass over Siberia which is extremely cold for most of the year (as low as -40°C in winter). This was the origin of the cold air in the famous “Beast from the East” weather in the UK in February 2018. Tropical regions produce warmer air masses which typically reach the UK from the West or South West.
The important point about air masses is their temperature. A cold mass of air, such as that over Siberia, will be dense and, as a result, will tend to move vertically downwards. Conversely warm masses of air will tend to rise, as they are lighter than the surrounding air or, more precisely, less dense. Cooler air sinking down raises the pressure of air where we live on the surface; this is the cause of a high pressure zone. Conversely, warm air rising is associated with low pressure at the surface.
In a low pressure zone, called a depression, the rising air will cool as it reaches higher altitudes. Air is a mixture of gases, one of which is water vapour. H2O molecules remain far apart and moving fast in the vapour state, while the temperature is sufficiently warm; but as they rise up, the temperature drops, slowing the molecules down until a point may be reached at which they come together, condensing into liquid water droplets. These droplets, in their millions, are what we see as clouds and, if the conditions are right, lead on to rain, sleet or snow, depending on how cold the temperatures are. This is why low pressure zones, with their rising air, are often associated with precipitation.
High pressure zones, on the other hand, are associated with descending air, which means it is moving downwards into ever warmer temperatures nearer the Earth’s surface. As a result the water vapour within the air mix does not condense out. Thus, clouds are less likely to form and weather conditions often remain relatively settled.
Wind
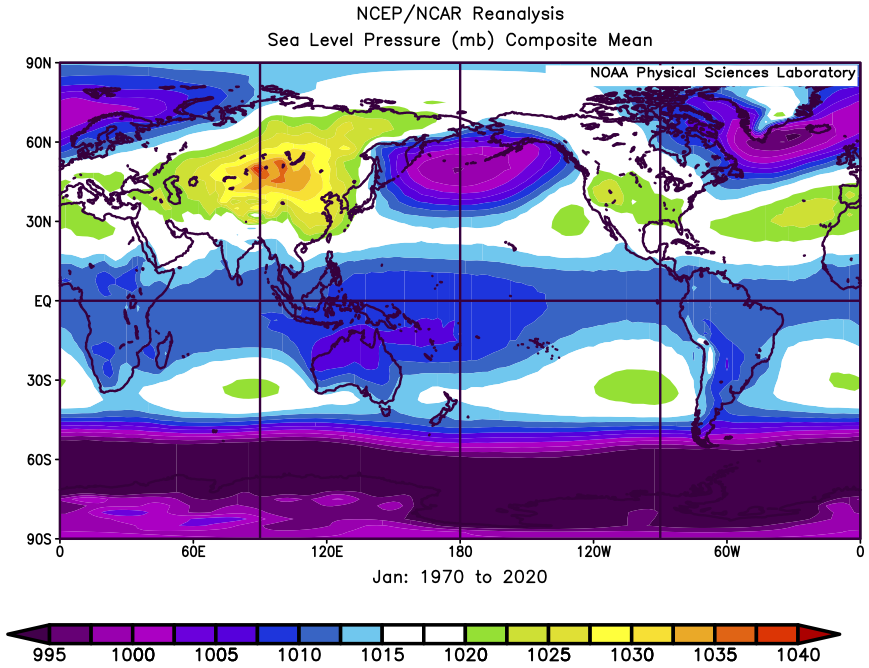
Although air, being invisible to us, may appear to be fairly static around us (except on windy days), it is, in fact, generally on the move in the vertical direction. In some regions of the world the air masses are cool and sinking downwards, in others they are warmer and rising. The image in figure 2, from the NOAA (National Oceanic and Atmospheric Administration) in the USA, shows the pressure of the atmosphere at sea level across the globe in January, averaged over 50 years. The blue and purple colours indicate low pressure zones, the green, yellow and orange indicate highs.
Having established that the pressure of the atmosphere and the nature of the weather are closely related, the discussion group probed the relationship further. Wendy wondered whether it was the pressure of the air that shapes the weather or the other way round. Jean asked whether it was wind that causes pressure differences or vice versa.
The simple fact is, as we know from bike tyres bursting or carbonated drinks fizzing, that gases rush from high pressure areas to low pressure ones, when free to do so. This inevitably means winds will be set up simply because of the differences in pressure across the globe. These differences in pressure have, in turn, been caused by differences in temperature between the polar and the equatorial regions So the winds, and the weather systems they bring, are caused by pressure differences, not the other way round. A simple one minute animation from the UK Met Office shows all this graphically.
On reflection it may seem odd that the winds in the UK and many other regions seem to come mainly from the West/South West and the East/North East. Given that the hotter regions are at the equator and the colder ones at the poles, you might reasonably expect winds to travel roughly along a North – South line. It’s the daily rotation of the Earth, however, that changes all this. As the Earth spins, the atmosphere surrounding it goes with it. However, as we know from spinning on a children’s roundabout, your actual speed at any point depends on how far you are from the axis: the farther out you are, the faster you go.
Even though we are usually quite unaware of it, the same goes for us on the surface of the Earth: people and things at the Equator are spinning through space much faster than people and things at the poles. The same goes for the air in the atmosphere. It’s spinning, together with the Earth itself, from West to East. Its moving fastest in the tropical regions and hardly at all at the poles. When air moves towards the poles it carries its faster eastward speed as well as its poleward speed. As a result, when it reaches higher latitudes, it is moving from west to east faster than the ground and the people on it are. What began as a wind directed towards the poles has become a wind directed partly towards the East: thanks to the spin of the Earth, it has been deflected by this so-called Coriolis effect. These are the conditions affecting Europe and much of northern America, in the mid latitudes (30° – 60°), where winds are moving towards the poles. It’s also true in the same latitudes in the southern hemisphere. In lower latitudes, nearer the tropics, the winds blow towards the equator and are deflected the other way – westward.
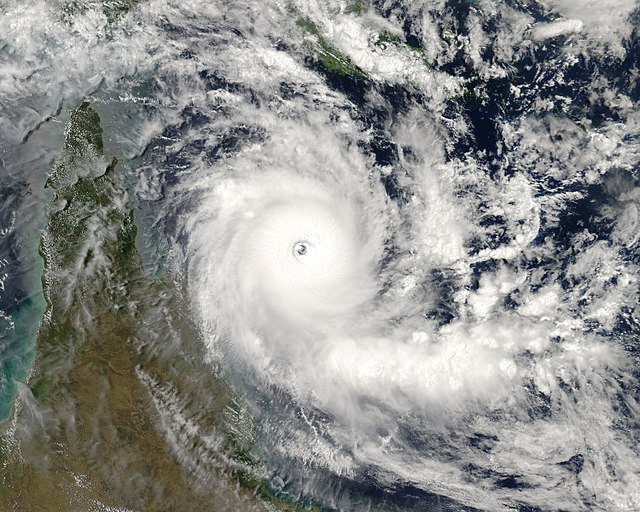
This deflection of air due to the spin of the Earth not only drives air masses in a more easterly or westerly direction, it also sets them spinning. This is why cyclones and anticyclones occur and are associated with low and high pressure, respectively. These are what we see as swirls of cloud in satellite images in weather reports (figure 3).
Figure 3 satellite image of a cyclone
In the case of a depression (low pressure zone), the air is moving vertically upwards. This causes surrounding air to be sucked in from all directions. The Coriolis effect means that air sucked on all sides is deflected to the right in the northern hemisphere (left in the southern). The net effect is to set the air mass into an anticlockwise spin in the northern hemisphere (the opposite in the Southern). This is called a cyclone. A clear image explaining the formation of a cyclone and anticyclone can be seen at https://ownyourweather.com/tag/how-does-an-anticyclone-form/ . I’ve always found the terminology around cyclones a bit confusing. A cyclone is simply a system of winds rotating inwards to an area of low barometric pressure. The US National Oceanic Administration tells us that tropical cyclones, hurricanes and typhoons and are all the same weather phenomenon.
Warm and cold fronts
Weather maps often show various kinds of lines. The thin black lines, known as isobars, in figure 1 above show where the pressure has one particular value. Thus, all along the line labelled 1012 the pressure is 12 units above the average of 1000 millibars. These are like contour lines on a physical geography map. Where the lines on such a map are packed close together it indicates a steep rise in height. Similalry, close packed isobar lines on a weather map indicate a steep change in pressure. This means the winds will be relatively strong due to the strong differences in pressure.
The other lines in figure 1, the coloured ones, represent “fronts”. These are the boundary zones between one air mass and another. Given that air around the globe is present in discrete masses rather than one homogeneous whole, there are inevitably boundaries between the masses. Air masses differ from one another: some are warm, some cold, some travel over land and are dry, others over the oceans and are loaded with water vapour. It’s hardly surprising, therefore, that when two different masses meet at a front, changes in weather are likely to occur. The United Kingdom happens to sit in a part of the globe where differing air masses are particularly likely to meet one another.
For example, a warm, moist mass of air travelling across the Atlantic towards the UK might meet a colder mass of air that has travelled from a more northerly region, over land.
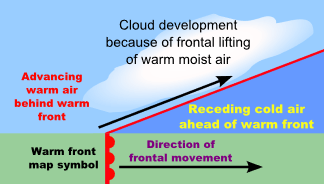
Where they meet the warmer air, being less dense, will rise up over the cooler, dense air. As it rise however its temperature will drop. Cool air cannot hold as much water vapour as warmer air; as a result clouds will form, potentially leading to precipitation.
Figure 4 A warm front
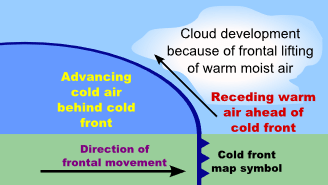
When a cold mass of air is moving forward and meets a warmer one, the boundary region is called a cold front. In this case the denser cold air pushes the warm air upwards as it advances, again causing the warmer air to cool and forcing out water vapour into the liquid droplets of clouds and potentially precipitation.
Figure 5 A cold front
Discussion of isobars and weather fronts put the group in mind of other phrases and ideas they had picked up from radio and TV programmes. “What about the jet stream” Jean asked. “I got the impression its very high up and wobbles around the globe” she recalled. “We never used to hear much about it, now it’s common knowledge. Isn’t it getting upset by the effects of climate change” interjected Helen. A brief description of the jet stream is given below in the Further Reading section.
Clouds
Moving on from the technicalities of weather maps and forecasts to more everyday experiences, discussion in the group turned next to clouds, rain and snow – common topics of conversation in the UK. Jean had picked up the idea that clouds are made of a mass of tiny water droplets, “hanging out with air molecules”, as she put it. Their appearance as something white and fluffy is due to the reflection of sunlight off the curved surface of the droplets. Reflecting on the appearance of clouds just before rainfall, Jean conjectured: “do grey ones carry more water?”.
The appearance of clouds to us on the ground is simply the result of light from the Sun above them passing through them to reach our eyes. As clouds build up and get thicker, light from the Sun has to pass though more and more droplets of rain (or tiny crystals of ice) before they reach us.
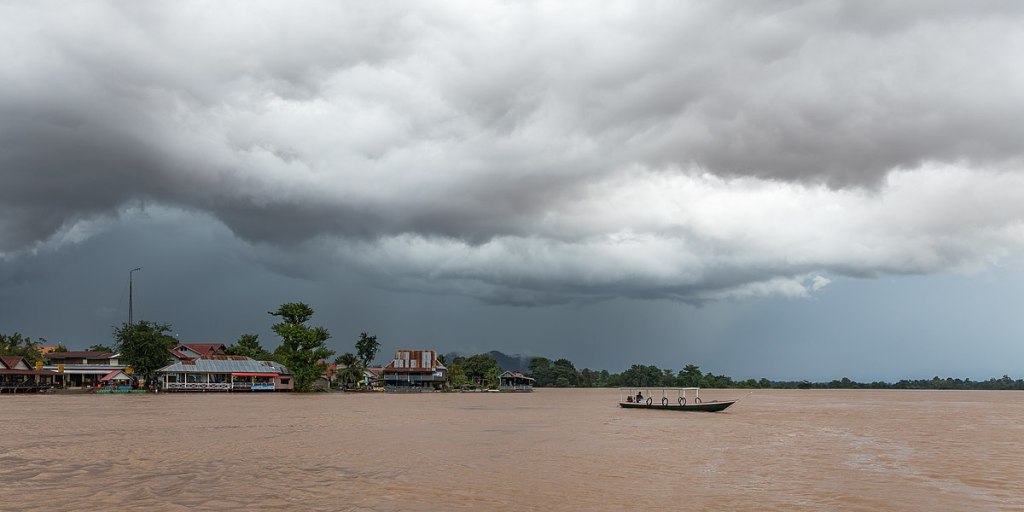
Figure 6 A raincloud
This reduces the intensity of the light that reaches us. As the droplets get more densely packed and larger, prior to falling as rain, even more sunlight fails to get through to the bottom of the cloud. As a result, clouds building up towards a fall of rain, block more and more sunlight, hence get darker. The colour grey had been aptly described as “pale white”. Grey clouds are simply white clouds which allow less light to pass through. You can see how the shade of grey deepens towards the bottom of a cloud, where less and less light manages to penetrate.
Rain, snow and ice
Clouds are formed when water is forced out of its invisible vapour state in the air, into visible liquid droplets. This occurs when air that has water vapour in its mixture, cools down for one reason or another. Cooler air is unable to hold as many H2O molecules in the vapour state as the same amount of warmer air. When the air cools below a certain point, H2O molecules have to condense out, forming droplets of liquid. Initially these are very tiny (around .02 millimetres across), so tiny that they are light enough to be held aloft by upward air currents. That’s why clouds can remain where they are despite being made of water droplets which have weight. However, if more and more water vapour continues to rise up into the cloud, more and more of it will condenses out as a liquid, using the tiny, first-formed droplets as nuclei upon which to condense. As a result, the initially tiny droplets grow larger and larger. At some point these may become too heavy for upward air currents to hold them aloft. They fall under gravity as raindrops; at around 2 millimetres across, these are around a hundred times larger than the initial tiny ones.
“What about snow?” asked Sally at this point. “Presumably it forms when the clouds are so cold, the droplets freeze?” “Aren’t snowflakes formed out of crystals of ice?”, Helen chipped in. “Why are they so regular?” Sometimes the temperature up at cloud level may not only be cool enough to cause droplets to condense out of the vapour in the air, but cold enough to cause such droplets to freeze. Under these conditions clouds consist of tiny ice crystals rather than water droplets. Various things can happen to these tiny ice crystals, giving rise to the different forms of snow, sleet and hail familiar in northerly climates. Under the right conditions, ice crystals will join together, forming the beautiful geometric snowflakes we see falling to the ground.
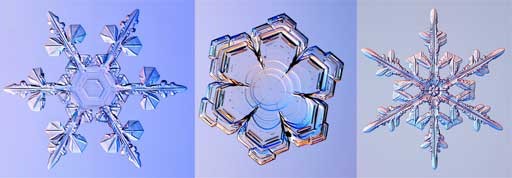
Snowflakes are formed when the tiny ice crystals in clouds join together in sufficient numbers to become heavy enough to fall to the ground. As snowflakes fall they pass through slightly warmer moist air and as a consequence, melt around the edges a little, join with their neighbours, then freeze again forming bigger flakes.
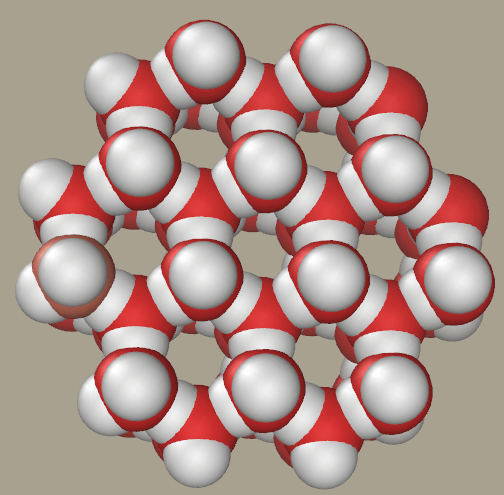
The beautiful hexagonal geometry that characterises snow flake derives from the way H2O molecules pack together at the nano scale, lining up in crystalline arrays with internal angles of precisely 120° (figure 8).There are endless ways in which flakes can grow along the six lines of symmetry as the examples in figure 7 shows.
Figure 8 H2O molecules in ice
On the other hand snowflakes may fall through cold, dry air and fail to stick together in larger flakes. This results in the powdery kind of snow beloved of skiers. Under different circumstances, hailstones maybe formed. This occurs in thunderclouds whose upper regions are particularly cold at relatively low altitudes. Water droplets carried up by the updraught of air begin to freeze as they reach the upper parts of the cloud. As they continue to rise, water freezes onto them forming layers of ice. They grow ever larger until too heavy to remain suspended in the updraft; ultimately they fall to earth as hailstones.
There’s a lot more to understanding the weather than we’ve covered here. We’ve not entered into the great vertical circulations of air – the so-called “cells” – that transport air upwards in some latitudes and push it down in others. We’ve missed the circulations of warm and cold water through the depths of the oceans, helping regulate our climate. We’ve hardly touched on the hot dry conditions in the equatorial regions. Yet, the basic concepts – the varying density of cold and warm air and the transition of H2O between its vaporous, liquid and icy solid states – go a long way to explaining why our weather patterns occur and what the esoteric marks on a meteorological map mean.
© Andrew Morris 28th March 2022
Further reading
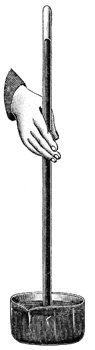
Interestingly, it was several hundred years ago, back in the 17th century, that a clever experiment was designed by the Italian, Torricelli in Italy to work out how much the pressure of the atmosphere was. He filled a long, thin tube with mercury (a very dense liquid) and by immersing it in a bowl of mercury, was able to balance the weight of air in the atmosphere against the weight of a column of mercury.
He found that the pressure of the whole atmosphere above us was balanced by just 76 centimetres of mercury. That’s why traditional household barometers are a little under a meter tall and use mercury to measure atmospheric pressure.
A labelled diagram explainig this principle can be seen here: https://physics.stackexchange.com/questions/481736/how-does-the-torricelli-barometer-create-a-vacuum-at-the-top-of-the-tube
Of course the purpose of a barometer is not simply to measure the average pressure of the atmosphere, but to detect small changes in it – a few thousands up or down from the average. There are several different units for recording atmospheric pressure. One “Atmosphere” or 1 “Bar” (or 1,000 milllibars) is approximately the average pressure at sea level and is equivalent to the 76 cms of mercury mentioned above. The value fluctuates, typically a few percent either way, according to weather conditions . The highest ever recorded was 1084 millibars, the lowest 870.
Figure 9. The principle of the barometer
Jet Stream
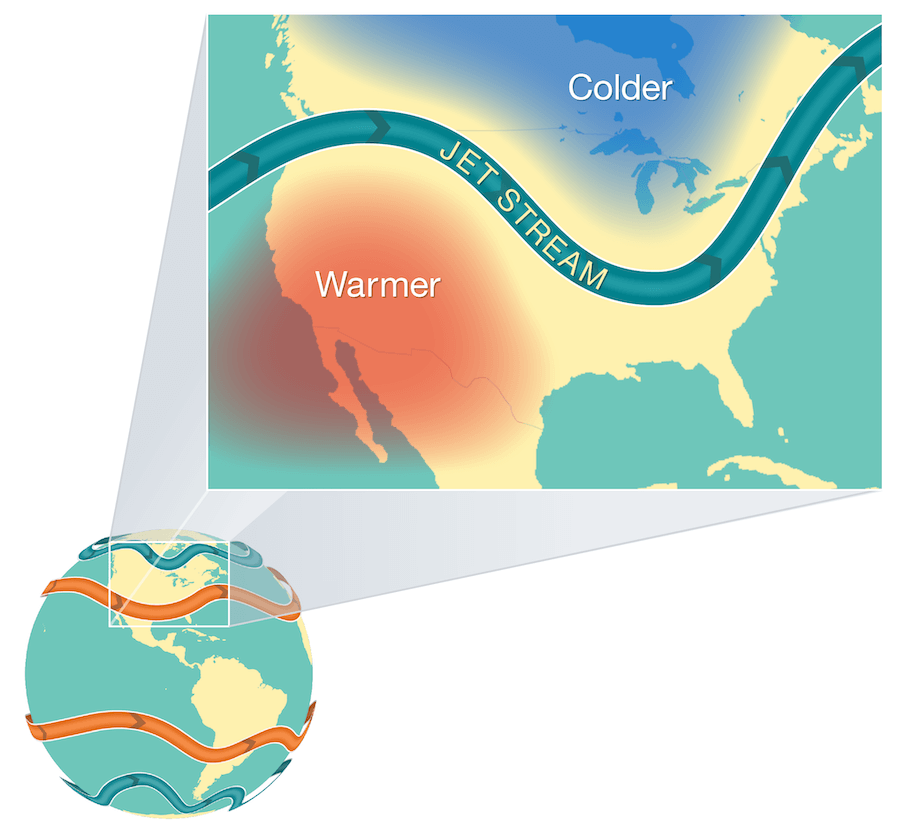
The jet stream is high up – around 5 to 7 miles above the Earth’s surface. It blows from west to east. Like winds closer to the surface, jet streams (there are four of them) are caused by differences in temperature between colder air towards the poles and warmer air from the tropics. Again, it’s the spin of the Earth that causes the wind to blow west-east rather than north-south. The path of the stream may be straight or it may bend into loops (figure 10).
Figure 10. Jet streams (image credit; NOAA)
A jet stream can move the air masses below it, affecting the weather we experience on the surface. It can speed up changes in weather, driving depressions forward for example. Conversely it can slow or stall them causing weather systems to stay overhead longer, perhaps causing excessive rain and flooding or prolonged cold or warmer conditions. Because of the speed of the winds, jet streams can alter weather patterns relatively rapidly.
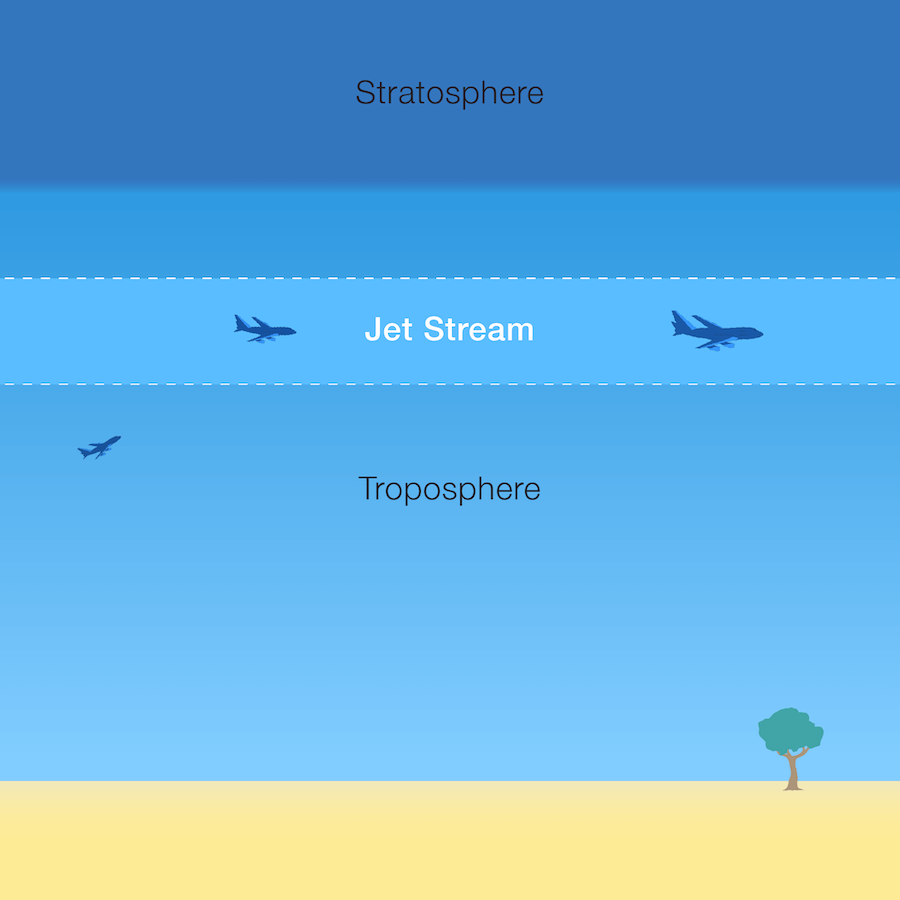
The altitude of jet streams corresponds generally to the cruising height of long distance aircraft. As they are strong winds, with typical speeds from 80 to 140 miles per hour, they can make a significant difference between eastward and westward journey times.
A helpful short video from the BBC explains the jet stream in plain English. https://www.bbc.co.uk/weather/features/54682820
Figure 11. Flying in the jet stream (image credit:NASA/JPL-Caltech
Jet streams are being affected by climate change, since the polar regions are warming faster than tropical regions. Research is suggesting the possibility that the jet stream may be weakened, causing it to slow down and buckle more, leading to more frequent extreme weather events.
© Andrew Morris 28th March 2022
